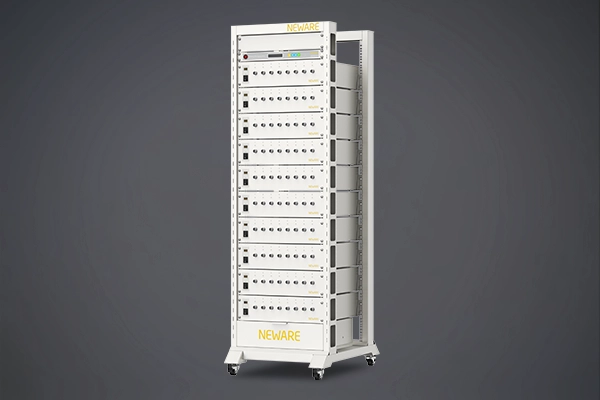
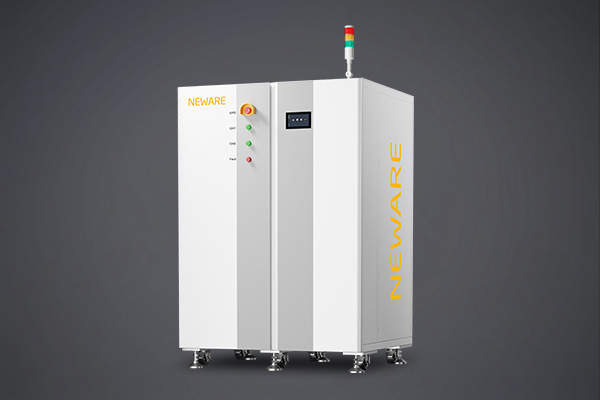
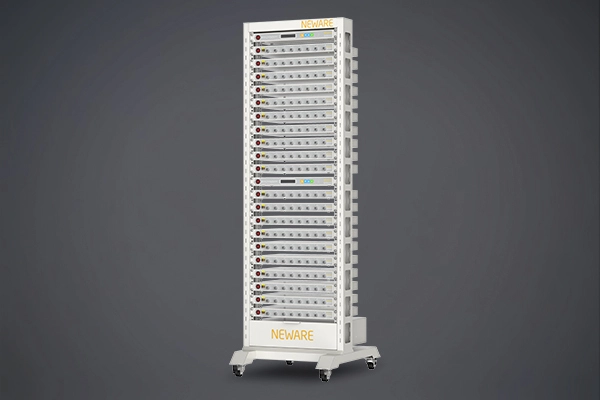
Global Distributor Recruitment | Create the Future of Battery Testing Together
NEWARE technologies learning center
Previous
Next
Sharp metal impurities present at the edges of electrode sheets can potentially puncture the separator, leading to a short circuit inside the battery.
The part of the negative electrode sheet that extends beyond the positive electrode sheet in either the length or width direction.
As part of quality management, it is dedicated to meeting quality requirements.
Quality characteristics that, if they exceed the specified value requirements, would result in the partial loss of product functionality.
During coating or drying, the alignment and position of the sheets are maintained correctly through the method of deflecting the sheet path direction and position by adjusting the angles of the rollers.
Quality characteristics that, if they exceed the specified value requirements, would directly impact product safety or lead to the loss of the product's overall functionality.
July 03, 2024
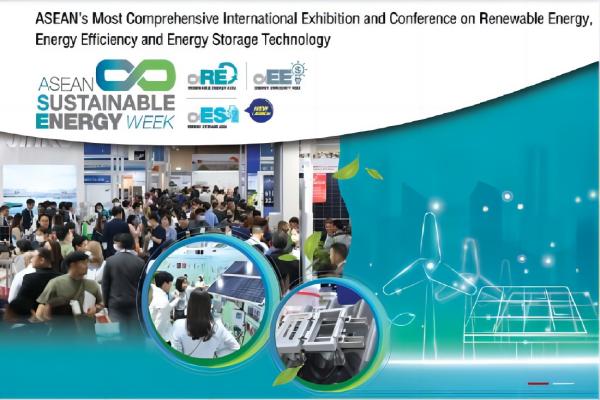
ENERGY STORAGE ASIA 2024, featured prominently at ASEAN SUSTAINABLE ENERGY WEEK, will serve as a hub for cutting-edge energy storage technologies from leading brands worldwide. It offers a unique opportunity for industry professionals to connect with high-quality suppliers, catering to the energy sector, and even the electric vehicle industry. This show is set to be a pivotal platform for industry players to explore new opportunities and collaborations in the dynamic energy landscape.
May 07, 2024
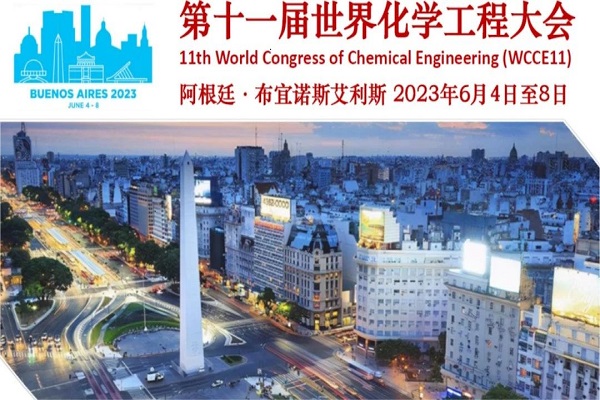
June 04, 2023
The World Congress of Chemical Engineering (WCCE) is organized by the World Federation of Chemical Engineering (WCEC) every four years, alternating between Europe, America and Asia, and is a global co
June 28, 2023
Batteries UK Birmingham is an international exhibition for the electric vehicle industry, dedicated to improving battery performance, cost and safety for manufacturers, users and the entire supply cha
March 06, 2024
EXHIBIT ITEMSBATTERY RECHARGEABLE: Lithium-ion Battery, NickelCadmium Battery, Air Cell, Energy Storage System, Nickel Metal HydrideBattery, Other Rechargeable Batteries/Storage TechnologiesCAPACITOR:
September 08, 2024
Nova Scotia has a growing battery technology cluster comprised of academic researchers at Dalhousie University and innovative industry players that are actively involved in the development of advanced battery technology. The IBA 2024 Annual Meeting in Halifax, NS, will be an ideal opportunity to link your organization with world-wide renowned battery researchers in a new center for battery R&D and to discuss exciting ideas in fundamental battery materials research and practical applications.