The potential (voltage) varies linearly with time, usually scanning back and forth between two set potential limits. By recording the current response, a cyclic curve of current-potential (i-E) can be obtained. This method provides information about the kinetics and mechanism of electrochemical reactions.
It is commonly used to study the reversibility of redox reactions, reaction mechanisms, electron transfer rates, and electrode material performance. It is applicable to the study of various electrochemical systems, including chemical substances in solution, electrode interfaces, and biomolecules.
By analyzing peak currents, peak potentials, and the shape of current responses in cyclic voltammograms, detailed information about the reaction can be obtained. Cyclic voltammograms typically consist of multiple cycles, allowing observation of reaction stability and reversibility.
The potential changes linearly at a constant scan rate without performing a back-and-forth scan. This method is primarily used to study the kinetics of electrode processes by analyzing the current-potential (i-E) curve, determining the rate-controlling step and electron transfer coefficient of the reaction.
It is mainly used for quantitative analysis and studying the kinetic parameters of electrode reactions, such as charge transfer resistance and diffusion coefficient. It is highly useful in the research of electrochemical sensors, corrosion science, and energy storage devices.
By analyzing the slope and shape of the current-potential curve, the kinetic parameters of the reaction can be determined. Linear voltammograms typically contain a single forward scan, focusing on studying the trend of current with respect to potential.
By applying a linearly changing electrode potential between the working electrode and reference electrode and simultaneously recording the current passing between the working electrode and auxiliary electrode, a voltammetric curve, i.e., a linear sweep voltammogram, representing the relationship between electrode current and electrode potential, is obtained. The rate of change of electrode potential is called the scan rate (v=dE/dt) and is constant. The relationship between electrode potential and time is given by:
E=E0±vt
where v is the scan rate of the electrode, V/s; E₀ is the initial scan potential of the electrode, V; t is time, s. The potential scan range can be divided into two categories: large amplitude and small amplitude. Large amplitude scans have a wider potential range and are commonly used to observe possible reactions occurring throughout the potential range, determine the reversibility of electrode processes, and measure electrode reaction parameters.
For reversible electrode processes, when the applied potential on the electrode surface reaches the decomposition voltage of the electroactive substance, the electrode reaction occurs, and the relationship between surface concentration and potential follows the Nernst equation. As the linear sweep voltage progresses, the electrode current rises sharply, the surface concentration of reactants on the electrode decreases rapidly, while the concentration of products increases. Due to the influence of material diffusion rates, reactants from the bulk solution cannot diffuse to the electrode surface in a timely manner, and products cannot completely leave the electrode surface in a timely manner. This leads to a "depletion" of reactants and an "accumulation" of products, causing a rapid decrease in electrode current, forming a peak-shaped voltammogram. If the linear scan voltage continues, electrolysis of the solution will occur, resulting in hydrogen or oxygen evolution peaks.(3)
For electrochemical reversible plate reactions, by solving the electrode process kinetics and Fick's diffusion law, the linear sweep voltammetry equation can be obtained. The characteristic peak current of the electrode reaction is:
ip=0.452(n3/2F3/2/R1/2T1/2)AD01/2v1/2c0
At 298K, equation (4) can be simplified to:
ip=269n3/2AD01/2v1/2c0
When the electrode reaction is irreversible, the linear sweep voltammetry peak current equation is:
ip=299nA(αnα)D01/2v1/2c0
where n is the number of electrons transferred in the electrode reaction, A is the effective working area of the electrode in cm², D₀ is the diffusion coefficient of the electrode reactant in the solution in cm²/s, v is the electrode potential scan rate in V/s, c₀ is the local concentration of the electrode reactant in mol/L, and i_(p) is the peak current in A.
Under the condition of a fixed effective working area A, the current equation can be simplified as:
ip=kv1/2c0
The peak current of the electrode reaction is directly proportional to the concentration of the electroactive species, which is the theoretical basis for quantitative determination in linear scan voltammetry. In general, the optimal concentration range for linear scan voltammetry is between 10^-2 and 10^-4 mol/L. The peak current of the electrode reaction is proportional to the square root of the scan rate of the electrode potential. Increasing the scan rate can enhance the sensitivity of the measurement. However, for irreversible electrode processes, where the electrode reaction rate is slow, fast scanning may prevent the electrode reaction from keeping up with the polarization rate, resulting in the absence of current peaks in the voltammogram. Therefore, slower scan rates should be used for substances with slower electrode reaction rates.
For reversible electrode reactions, the peak potential on the voltammogram depends on the composition and concentration of the electrolyte solution, independent of the scan rate. The expression for the peak potential is:
Ep=E1/2±1.1(RT/nF)
When the electron transfer number (n) of the electrode reaction is 1, the peak potential of the current is shifted by 28.5 to 31.5 mV relative to the equilibrium potential. The rise of the current peak is very rapid, reaching approximately 100 mV in the initial 10% of the rise corresponding to the electrode potential. When the electrode reaction is irreversible (semi-reversible or completely irreversible), the peak potential (Ep) shifts negatively (or positively) with increasing scan rate.
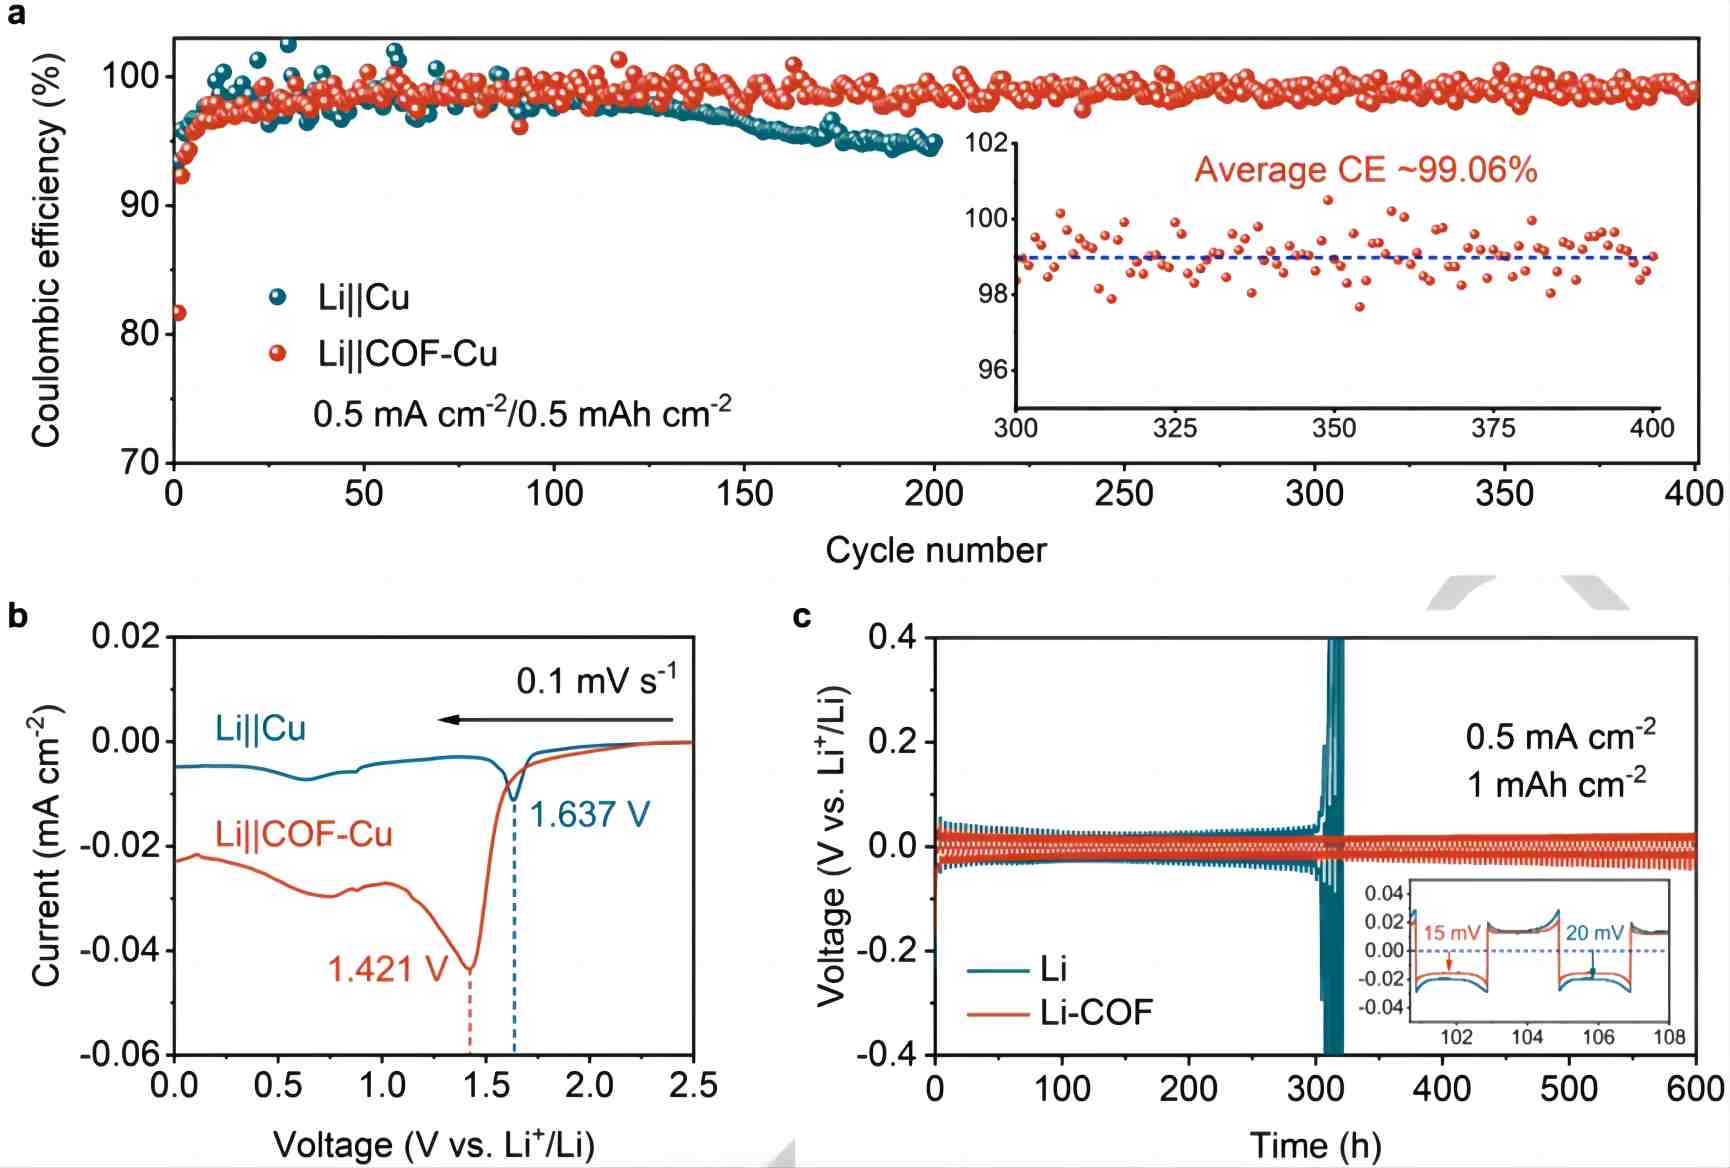
Figure 3:
a) Coulombic efficiency of Li||Cu and Li||COF-Cu batteries tested at 0.5 mAh cm^-2 under 0.5 mA cm^-2. The inset shows the Coulombic efficiency of Li||COF-Cu within the range of 300-400 cycles.
b) Linear sweep voltammetry (LSV) curves of Li||Cu and Li||COF-Cu batteries at 0.1 mV s^-1.
c) Cycling performance of symmetric Li||Li and Li-COF batteries.
The researchers investigated the utilization of lithium ions during the electroplating process by assembling an asymmetric Li||Cu half-cell. COF-Cu electrodes were prepared by coating bare copper foil with HAHATN-PMDA-COF, resulting in significantly improved performance compared to the copper electrode. As shown in Figure 3a, the Coulombic efficiency of Li||COF-Cu increased from the original 92% to 99% when the current density was 0.5 mA cm^-2, and it remained stable after 400 cycles. The initial low Coulombic efficiency is attributed to the large surface area of HAHATN-PMDA-COF, which absorbs a considerable amount of electrolyte, forming a solid electrolyte interphase. This phenomenon is validated by the linear sweep voltammetry curves (Figure 3b). In contrast, the initial Coulombic efficiency of Li||Cu battery was 98%, but it rapidly declined to 95% after 200 cycles. These results demonstrate that the HAHATN-PMDA-COF coating effectively mitigates the loss of active lithium. Additionally, the reduction peak area of Li||COF-Cu battery is larger than that of Li||Cu battery. However, the initial reduction potential of Li||COF-Cu shifted from 1.637 V to 1.421 V compared to Li||Cu, indicating the suppression of lithium deposition reactivity towards the electrolyte. The overpotential of Li||COF-Cu battery quickly reaches a steady state after the first activation cycle due to the induction of electrolyte decomposition by HAHATN-PMDA-COF, forming a denser solid electrolyte interface compared to the bare copper electrode, thus reducing continuous electrolyte consumption.
NEWARE TECHNOLOGY LLC
755 Ames Avenue, Milpitas, CA, USA, 95035


