Improving the cost-effectiveness of lithium-ion batteries requires cathode materials with readily available composition elements and highly tunable characteristics. Iron-based disordered rock salt (Fe-DRX) cathode materials are an ideal choice due to their optimal cost-effectiveness. However, the energy density of Fe-DRX is still insufficient to meet the demands due to limited Fe³⁺/Fe⁴⁺ redox and dependence on O²⁻ oxidation/reduction. Therefore, it is highly valuable to explore the potential performance of Fe-DRX by enhancing the redox activity of iron in the material.
Recently, Jinhyuk Lee and colleagues from McGill University in Canada published a research article titled "Redox Engineering of Fe-Rich Disordered Rock-Salt Li-Ion Cathode Materials" in the renowned journal Advanced Energy Materials. They successfully introduced Fe²⁺/Fe³⁺ redox couples into Fe-DRX, which relies on Fe³⁺/Fe⁴⁺ and O²⁻ redox, by partially substituting F⁻ for O²⁻. The lower oxidation potential and high reversibility of the reaction endowed Fe-DRX with high capacity (~290 mAh g⁻¹) and high energy density (~700 Wh kg⁻¹) while reducing the dependence on limited Fe³⁺/Fe⁴⁺ and O²⁻ redox. This research provides a new perspective for the development of Fe-based lithium-ion battery cathode materials.
The introduction of Fe²⁺/Fe³⁺ redox couples in Fe-DRX through fluorine doping reduces the dependence on Fe³⁺/Fe⁴⁺ and O²⁻ redox, resulting in excellent capacity and density.
The structure of disordered rock salt (DRX) materials can accommodate various transition metal (TM) ions and anions, providing an opportunity for the development of economically efficient cathode materials. However, the performance of Fe-DRX, which is considered the most economically viable, is still unsatisfactory. As shown in Figure 1a, the reported capacity of Fe³⁺-DRX is derived from the Fe³⁺/Fe⁴⁺ redox couple, which requires a high oxidation potential. Due to the overlap between Fe 3d orbitals and O 2p orbitals, some oxygen is excited and contributes to the capacity. However, the associated oxygen loss, irreversible cation migration, and electrolyte decomposition lead to a decrease in capacity and voltage. The key to improving DRX performance is to reduce dependence on oxygen redox and maximize TM redox. For Fe³⁺-DRX, this means lowering the reaction potential of Fe³⁺/Fe⁴⁺ to avoid oxygen excitation. In Li₂Fe³⁺_(0.5)Mn³⁺_(0.5)O₂F, the Mn³⁺/Mn⁴⁺ couple effectively lowers the reaction potential of Fe³⁺/Fe⁴⁺. Considering the inherent instability of Fe³⁺/Fe⁴⁺ redox in DRXs, developing Fe²⁺-DRX through partial substitution of F⁻ for O²⁻ seems to be a good choice. This study analyzes and compares the differences in redox reaction mechanisms and performance between Fe²⁺-DRX and Fe³⁺-DRX. The capacity of the synthesized LFNO is derived from the Fe³⁺/Fe⁴⁺ and O redox couples, while the capacity of LFNOF is derived from Fe²⁺/Fe³⁺/Fe⁴⁺. The Nb⁵⁺ ion in both materials is essentially not involved in the redox processes (the theoretical capacities of Fe³⁺/Fe⁴⁺ and Fe²⁺/Fe³⁺/Fe⁴⁺ are 174 mAh g⁻¹ and 341 mAh g⁻¹, respectively). Figure 1b shows the SEM images of LFNO and LFNOF, both of which exhibit loosely packed polycrystalline nanoparticles. Figures 1c,1d present the powder XRD patterns of LFNO and LFNOF, respectively, with all peaks attributed to the disordered rock salt structure (space group: Fm3m). The lattice parameter of LFNO is 4.1807 Å, while the larger radius of Fe²⁺ results in a slightly larger lattice parameter of 4.2031 Å for LFNOF. Figures 1e,1f display the powder XPS spectra of LFNO and LFNOF, respectively. In LFNO, Fe is mainly present as Fe³⁺ or Fe⁴⁺, while in LFNOF, Fe is predominantly in the Fe²⁺ or Fe³⁺ state. Overall, the average oxidation state of Fe in LFNOF is lower than in LFNO (LFNOThe respective values were ~2.7% and ~3.2%, both lower than that of LiFePO4 (~6.8%), indicating excellent mechanical stability of the DRXs.F is close to Fe²⁺, while LFNO is close to Fe³⁺).
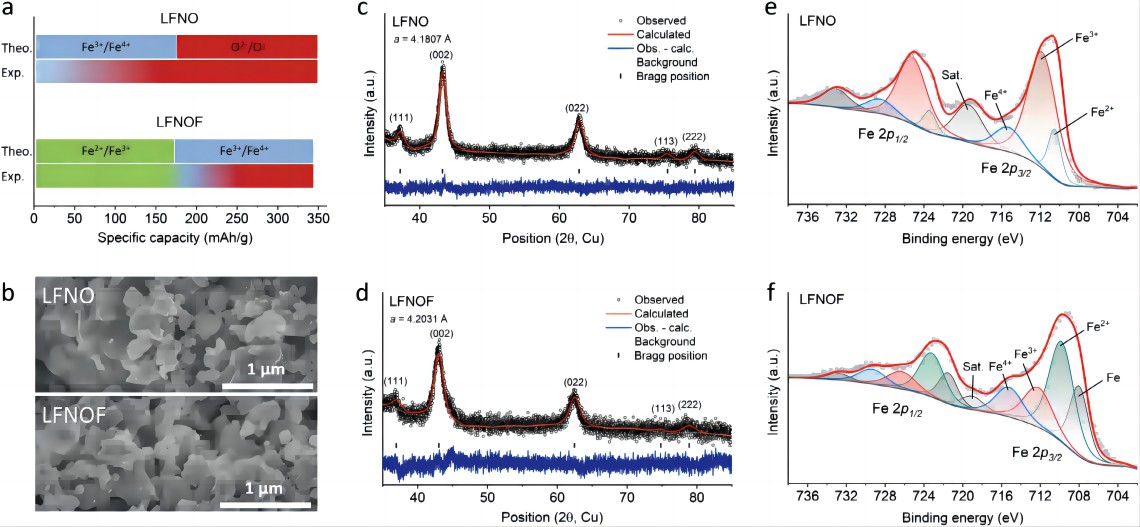
Figure 1.Structural characterization of Li1.2Fe0.6Nb0.2O2 (LFNO) and Li1.2Fe0.6Nb0.2O1.4F0.6 (LFNOF) powders. a) Comparison of the theoretical and experimental specific capacities contributed by Fe redox in LFNO and LFNOF, with the difference attributed to O redox; b) SEM images; c) XRD patterns of LFNO and d) LFNOF powders; e) XPS spectra of LFNO and f) LFNOF powders.
Figures 2a,2b show the capacity-voltage curves of LFNO and LFNOF under room temperature, 40 mA g⁻¹, and 1.3-4.8 V testing conditions. Before cycling, the open-circuit voltage of LFNOF (~2.2 V) is lower than that of LFNO (~2.5 V), indicating a higher reduced state of LFNOF compared to LFNO. The first discharge specific capacity and specific energy of LFNO are 243 mAh g⁻¹ and 599 Wh kg⁻¹, respectively, while those of LFNOF are 292 mAh g⁻¹ and an excellent 704 Wh kg⁻¹ (reference: LiFePO4, LiFeSO4F, and Li2FeSiO4 are 560, 500, and 440 Wh kg⁻¹, respectively). The first charge curves of both materials consist of a low-voltage plateau at ~2.7 V and a high-voltage plateau at ~4.2 V. LFNO is mainly dominated by the high-voltage plateau at ~4.2 V, while LFNOF contributes a high specific capacity of ~130 mAh g⁻¹ between 2.7-4.3 V. Previous reports indicate that the ~4.2 V plateau in LFNO during charging is mainly contributed by O oxidation and a small amount of Fe3+/Fe4+ oxidation. Therefore, the increased Fe2+/Fe3+ oxidation in LFNOF provides more charge-specific capacity. In the second cycle charge-discharge curves (Figure 2c), LFNO exhibits significant voltage hysteresis and polarization. In layered-rich lithium and DRX cathode materials, the uneven oxidation-reduction of O causes voltage hysteresis and the formation of oxygen dimers (such as peroxides, superoxides, O2) at high charging voltages, which can only be reduced at low voltages. Therefore, compared to LFNOF, the significant voltage hysteresis in LFNO indicates the involvement of more O in the redox reactions of the material. Figures 2d,2e show the dQ/dV plots of LFNO and LFNOF, respectively, with more pronounced changes observed in LFNO. During cycling, the high-voltage charging peak (>4 V) of LFNO rapidly disappears, and the low-voltage discharge peak (~2.7 V) shifts towards lower voltages, which can be attributed to irreversible O loss. In contrast, the discharge voltage decay of LFNOF is slower (Figure 2f), with an average voltage decay of only 57 mV after 10 cycles, while LFNO shows a decay of 254 mV.
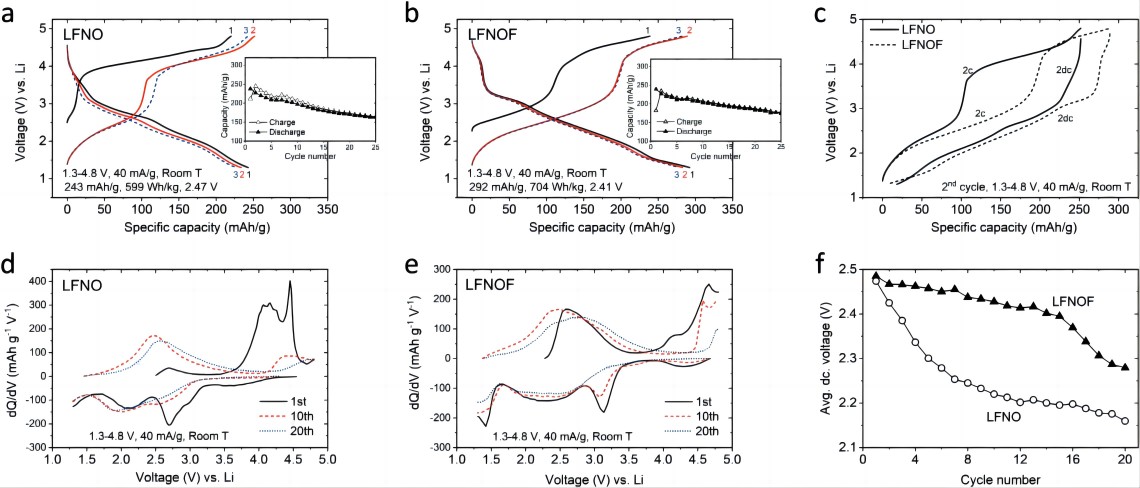
Figure 2. Electrochemical characterization of LFNO and LFNOF cathodes. Under the testing conditions of 1.3-4.8 V and 40 mA g⁻¹: a) Specific capacity-voltage curves of LFNO and b) LFNOF for the first three cycles, with inset showing the cycle capacity curves; c) Charge-discharge curves of LFNO and LFNOF for the second cycle; d) dQ/dV curves of LFNO and e) LFNOF for the 1st, 10th, and 20th cycles; f) Average discharge voltage of LFNO and LFNOF.
As shown in Figures 3a-d, the performance of LFNO and LFNOF was further compared under testing conditions of 1.3-(4.6/4.4) V and 40 mA g⁻¹. The discharge specific capacity of LFNO (LFNOF) decreased from 238 (239) mAh g⁻¹ to 163 (174) mAh g⁻¹ after 25 cycles between 1.3-4.6 V, and from 213 (217) mAh g⁻¹ to 164 (185) mAh g⁻¹ between 1.3-4.4 V. The average discharge voltage decay of LFNOF was also significantly smaller than that of LFNO (Figure 3e).
Therefore, with the decrease in charging cutoff voltage, the capacity and voltage retention improved, and LFNOF exhibited a more stable performance than LFNO in all voltage windows. It is worth noting that as the charging cutoff voltage decreased (from 4.8 V to 4.4 V), the rate of decrease in the first cycle discharge specific energy of LFNO was slower than that of LFNOF (Figure 3f). The rate performance of LFNOF was slightly better than LFNO (Figures 3g, h). According to GITT (Figure 3i), the high capacity of LFNOF may be attributed to its higher Li⁺ diffusion coefficient.
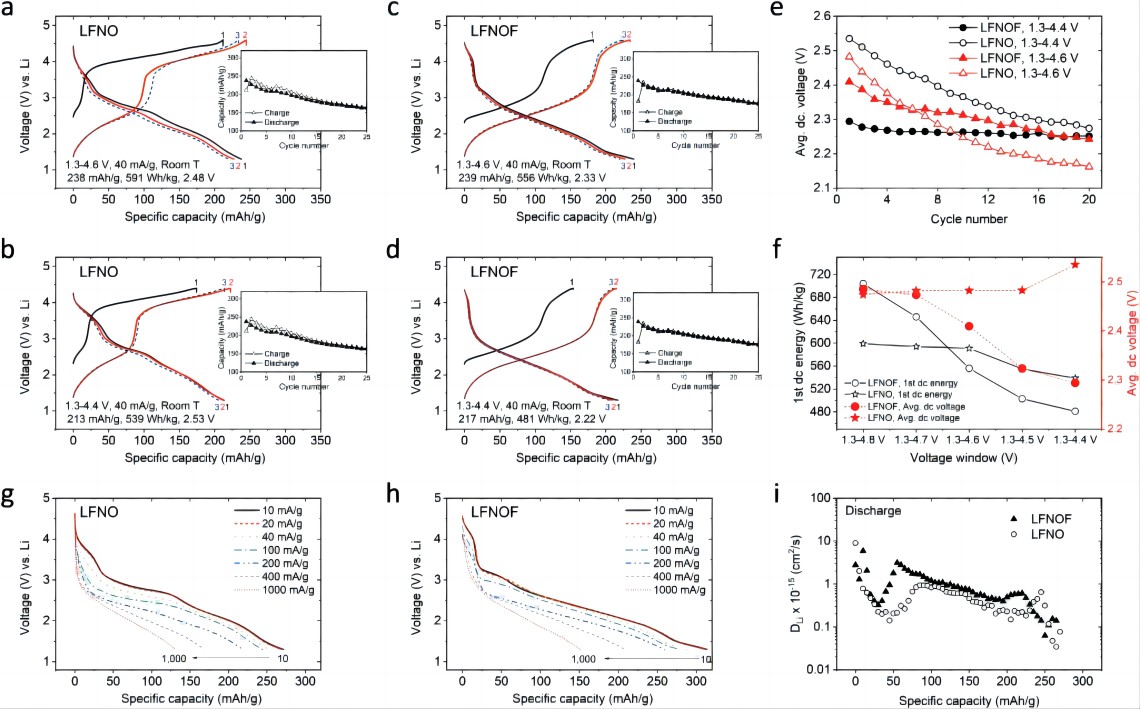
Figure 3. Performance of LFNO and LFNOF at different cutoff voltages and rates. Under testing conditions of 1.3-(4.6/4.4) V and 40 mA g⁻¹, a, b) the specific capacity-voltage curves of LFNO and c, d) LFNOF for the first three cycles; e) average discharge voltage from the a-b plots; f) first cycle discharge specific energy and average discharge voltage of LFNO and LFNOF at 40 mA g⁻¹ and (1.3-4.8/4.7/4.6/4.5/4.4 V); g) voltage curves of LFNO and h) LFNOF at 1.3-4.8 V charge-discharge voltage and 20 mA g⁻¹ charge current, and discharge currents of 10, 20, 40, 100, 200, 400, and 1000 mA g⁻¹; i) Li diffusion coefficient calculated based on GITT.
To analyze the redox mechanism of LFNO and LFNOF, the oxidation states of Fe and O elements at different states of charge (SoC) were detected using ex-situ XPS (Figure 4a, b). Additionally, the proportion (%) of Fe and O species at each SoC was estimated through XPS fitting (Figure 4c, d). Throughout the charging process, the average oxidation state of Fe in LFNO first increased and then decreased. The initial increase in the average oxidation state was attributed to an increase in Fe⁴⁺, while a portion of Fe remained in the 3+ or 2+ state. The later decrease in the average oxidation state might be due to the reduction coupling between Fe and O. The O 1s XPS spectra showed that oxidation of O²⁻ occurred as early as at 80 mAh g⁻¹ charge (C80), and the number of oxidized O species continued to increase with further charging (Figure 4c). During discharge (D80, D160, EoD), the Fe 2p_(3/2) spectrum shifted towards lower binding energy, while the number of oxidized O species decreased continuously, indicating reduction of Fe and O (Figure 4a, c). It is worth noting that the average oxidation state of Fe in LFNO after one charge-discharge cycle was lower than before, which can be attributed to charge compensation caused by O loss. The redox of Fe in LFNOF was clearer and mainly involved the oxidation of Fe²⁺ to Fe³⁺ (Figure 4b, d). Throughout the charging process, the peak intensity of Fe²⁺ continuously decreased, while Fe³⁺ and Fe⁴⁺ peak intensities increased, with Fe³⁺ reaching the highest intensity at ToC, indicating the limited oxidation of Fe³⁺/Fe⁴⁺ in LFNOF. The amount of O species in LFNOF was also lower than in LFNO (Figure 4d). These results indicate that oxidation of Fe²⁺/Fe³⁺ occurs more easily in LFNOF, leading to reduced oxidation of O, which is consistent with the ~2.7 V charging plateau. EPR spectroscopy confirmed the redox activity of Fe in LFNO and LFNOF (Figure 4e, f), showing that the oxidation of Fe²⁺/Fe³⁺ is easier in LFNOF, while the oxidation of Fe³⁺/Fe⁴⁺ is limited in both LFNO and LFNOF. Figures 4g and h show the evolution of the (002) peak in LFNO and LFNOF during the first charge-discharge cycle. The (002) peak of LFNOF shifts towards higher angles during charging and recovers to nearly the initial state after discharge (Figure 4h), corresponding to structural evolution of typical DRXs from ~4.215 Å (BC) to ~4.174 Å (ToC), and then ~4.220 Å (EoD) (Figure 4j). The (002) peak of LFNO continuously moves towards lower angles during charge-discharge, changing from ~4.191 Å (BC) to ~4.197 Å (ToC), and then ~4.222 Å (EoD), which is different from the typical behavior of DRXs. In DRXs, the volume usually decreases during charging due to the shrinking of ions (TM or O) during oxidation, while the volume expansion in LFNO is related to the oxidation of O and the formation of excess oxygen dimers. This process often leads to Fe-O bond breaking, thereby increasing the average TM-O distance in LFNO. As shown in Figures 4i and j, the first cycle volume changes (from minimum to maximum) for LFNO and LFNO.The respective values were ~2.7% and ~3.2%, both lower than that of LiFePO4 (~6.8%), indicating excellent mechanical stability of the DRXs.
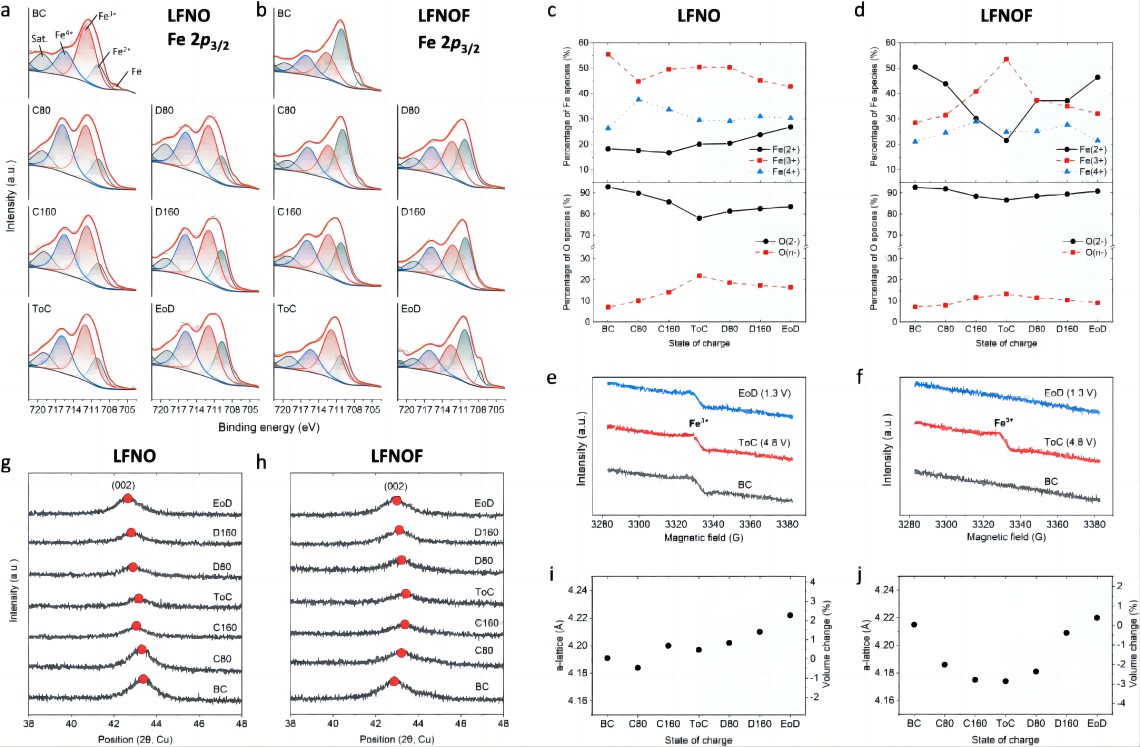
Figure 4. Redox mechanism of LFNO and LFNOF cathodes. Under the testing conditions of 40 mA g⁻¹: a) Fe 2p_(3/2) XPS spectra of LFNO and b) LFNOF for the first cycle, before charging (BC), charging to 80 and 160 mAh g⁻¹ (C80, C160), charging to 4.8 V (ToC), discharging to 80 and 160 mAh g⁻¹ (D80, D160), and discharging to 1.3 V (EoD); c) Variation of Fe²⁺, Fe³⁺, Fe⁴⁺, O²⁻, and O^(n-) content in LFNO and d) LFNOF at different charge/discharge stages based on XPS fitting peak area; e) EPR spectra of Fe³⁺ at different stages of charge/discharge for LFNO and f) LFNOF at 40 mA g⁻¹; Evolution of (002) peak g) and corresponding lattice parameters i) for LFNO and h) and LFNOF obtained from non-in situ XRD measurements.
The voltage profiles of LFNO and LFNOF obtained through DFT calculations match well with the experimental results. For example, the presence of two charging voltage plateaus at ~2.7 V and ~4.3 V in LFNOF (Figure 5a, b) indicates the effective prediction capability of DFT. Subsequently, the oxidation states of Fe and O in LFNO and LFNOF were investigated (Figure 5c, d). In LFNO, Fe³⁺/Fe⁴⁺ and O²⁻/O^(n−) oxidations were observed, with a limited presence of Fe³⁺/Fe⁴⁺. At deep delithiation stages (x=1.111 and 1.222), only 30% and 40% of Fe⁴⁺ were observed, indicating limited Fe³⁺/Fe⁴⁺ reactions. When the delithiation level of LFNOF reached 0.666 (x=0.666), Fe²⁺ was completely oxidized to Fe³⁺, with minimal oxidation of O during this stage. Further delithiation led to simultaneous oxidation of Fe³⁺/Fe⁴⁺ and O²⁻/O^(n−). These DFT results demonstrate that compared to LFNO, LFNOF facilitates the Fe²⁺/Fe³⁺ redox reaction while reducing the oxidation of O in the material. After complete delithiation, the content of oxygen dimers (1 oxygen dimer per 36 O atoms) in LFNOF is significantly lower than in LFNO (2 oxygen dimers per 36 O atoms) (Figure 5e, f).

Figure 5.Computational study of the redox mechanism of LFNO and LFNOF. a) DFT voltage curves and GITT first cycle charge curves of LFNO and b) LFNOF; c) Percentage of different oxidation states of Fe and O relative to Li content in LFNO and d) LFNOF; e) Oxygen dimers (represented by black dashed lines) and O-O bond lengths in the structures of LFNO and f) LFNOF obtained from DFT calculations.
Compared to other transition metals (TMs) such as Ni, Co, Mn, V, Mo, Fe offers excellent economic benefits. By adjusting the redox process of Fe in the DRX structure, high-energy density (approximately 700 Wh kg⁻¹) lithium-ion cathode materials can be synthesized. Additionally, LFNOF exhibits high mechanical stability, resulting in minimal volume changes during cycling. If an average discharge voltage of ~3.0 V can be achieved for Fe-DRXs, their energy density can be comparable to extensively studied Mn-DRXs. One possible modification strategy is to introduce P or B into the structure to form P-O or B-O bonds, which enhance Fe-O ion bonding and properties, thereby reducing Fe 3d orbital occupation and improving the operating voltage of Fe-DRXs. Furthermore, P (B)-O can enhance the stability of lattice oxygen during the charging process, contributing to voltage and cycling stability.
This study introduced Fe²⁺/Fe³⁺ redox couples into Fe-DRXs through fluorination. Compared to Fe³⁺-DRX, Fe²⁺/Fe³⁺ redox couples reduce the dependence of Fe²⁺-DRX on O non-reversible oxidation under high voltage and voltage hysteresis, resulting in a high energy density (approximately 700 Wh kg⁻¹), which is the best reported among Fe-based cathode materials to date. After voltage reduction, the energy density of Fe³⁺-DRX surpasses that of Fe²⁺-DRX. Therefore, combining Fe³⁺/Fe⁴⁺ and Fe²⁺/Fe³⁺ in Fe-DRXs helps achieve high energy density within a narrower voltage window. This study provides a new strategy for designing low-cost and high-performance Fe-DRX cathodes.
Richie Fong, Nauman Mubarak, Sang-Wook Park, Gregory Lazaris, Yiwei Liu, Rahul Malik, Dong-Hwa Seo, and Jinhyuk Lee*. Redox Engineering of Fe-Rich Disordered Rock-Salt Li-Ion Cathode Materials. Adv. Energy Mater., 2024.
https://doi.org/10.1002/aenm.202400402
NEWARE TECHNOLOGY LLC
755 Ames Avenue, Milpitas, CA, USA, 95035


